

The Alberta COVID Death Data Fraud
The Alberta COVID Death Data Fraud
Sorting it all out.

Appreciating that I’ve already busted out a lot of this data in previous posts, my readership has grown by 10x and to be perfectly honest, I only Half-Assed it when I originally did the dive - so figured I’d go back and fully sort out this mess for clarity and the newer subscribers. Besides my readership awareness and sorting this out, this information is going to be used for my coverage of the Dr. Deena Goes to Court series to identify just how fraudulent this woman has actually been over the last 2 years.
For the most part, a lot of us already appreciate that the information provided by the Province of Alberta via Alberta Health Services is complete bullshit but most really aren’t aware of how bad this actually is.
To give a full idea of what I am doing and how I’ve found this data and of course, if you are not that familiar with the Provincial Website →Here, don’t worry. I am going to, take a hopefully not too painful time, fully explaining it.
When you click the link, it goes to the Alberta Highlights Homepage - COVID Dashboard. From here, you can view the Hospitalizations, ICU admissions, Deaths, Cases….and at current, you’d see that there are 4,104 Total Deaths, as of the last reported date - April 4, 2022:
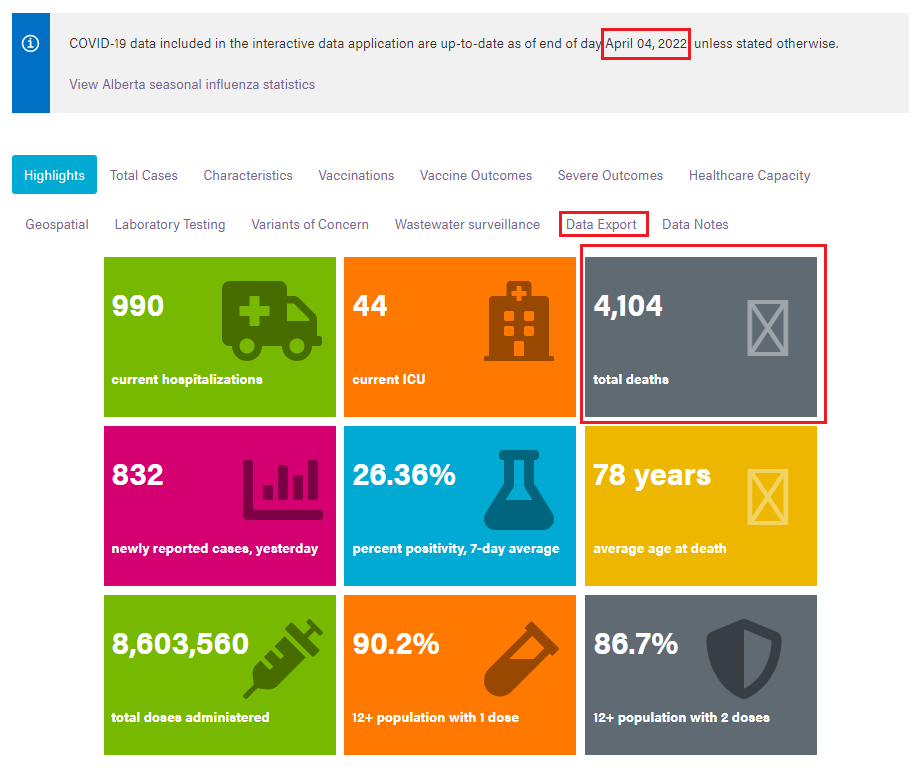
And also on this, which I’ve highlighted, you can see the Data Export. If you clicked onto this tab, you can download the Raw Data from the Province and dig into what this looks like - spread sheet. The link that you’d click on to get this data looks like this:
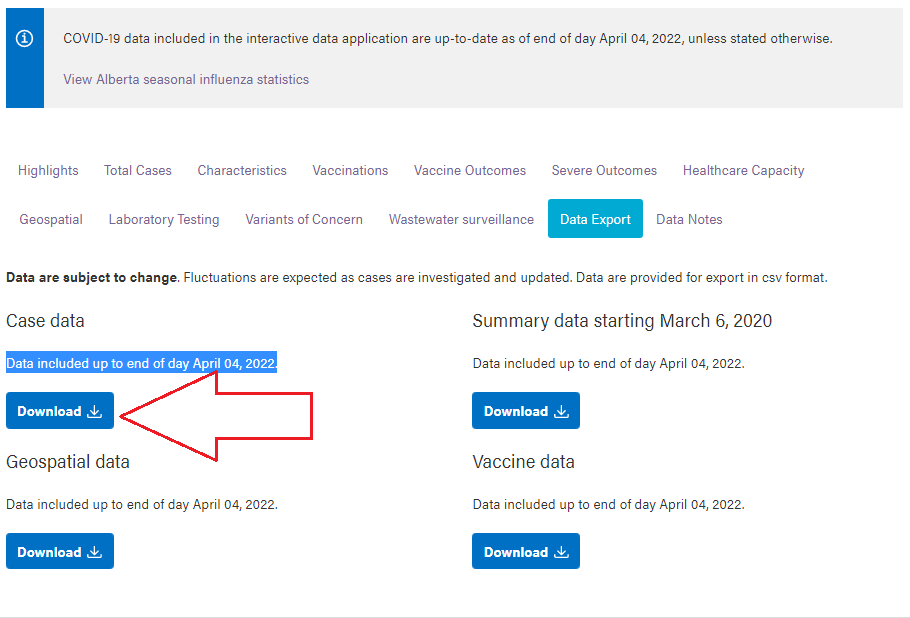
You get a single tab that has all of the cases for the province and if you sort through these you can isolate deaths, and you would see that in fact, the data-to-date, shows the exact same 4,104 deaths that the ‘Highlights’ page shows.
Because, why would they be different?
Now, it was in drilling out information last year that I realized that something was amiss. The numbers were in fact changing and and were seemingly a lot larger than I had recollected. I’m old…memory isn’t as sharp as it used to be, so I actually went back and checked this with previous versions that I downloaded and I was right…The numbers were up.
By a lot.
To try and figure out how many this number actually is, is a very difficult thing to do and there really is no way to know without having downloaded this document daily and followed every ‘Highlight’ to see how bad these numbers were actually forged.
Soooooooo…what I am going to do is just show where the biggest issue(s) seem to be and give a sense of how bad the fraud was and will carry on with my thoughts on this in the Deena Hinshaw follow ups.
Let’s start here. December 29, 2020 →Dashboard:
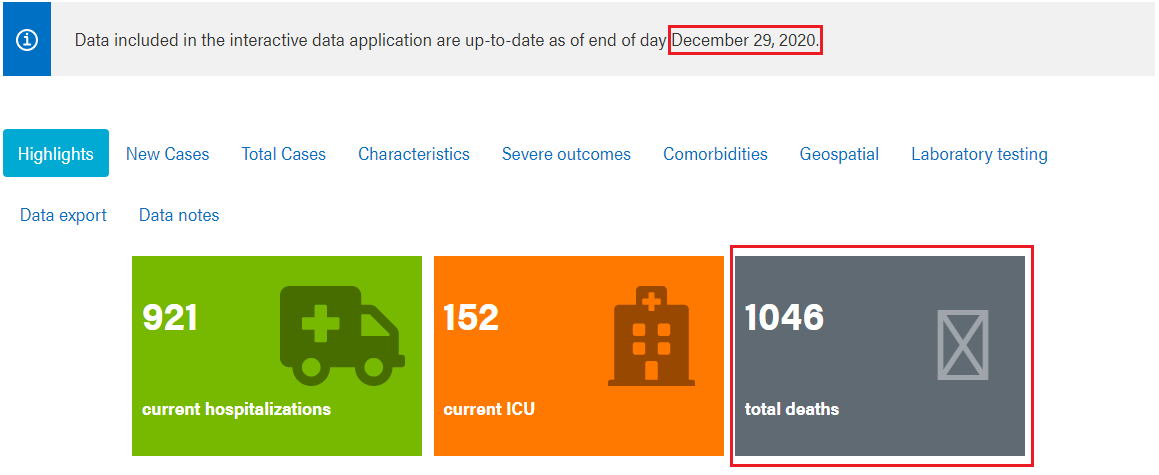
On this day, there were 1046 deaths reported. Because this is a December 29th report, the deaths to this day were as of December 28th, 2020 - updates coming out the afternoon of the 29th, giving one day lag, (it’s only because we’ve shifted to weekly reporting that the highlights and the data match up now).
This was the Last reporting date for the Christmas season and then there was some lag into the New Year…I will cover this, but just to say that this is why I had selected this instead of using December 31st, 2020 or January 1st, 2021.
If you had downloaded the data from the links above, sorted out all of the Deaths and separated them by year, what you’d see is that for 2020, the data now shows that there are 1,531 deaths, meaning that for December 29th, 30th and 31st, there were (1531-1046)= 485 Deaths, or around 162 deaths per day.
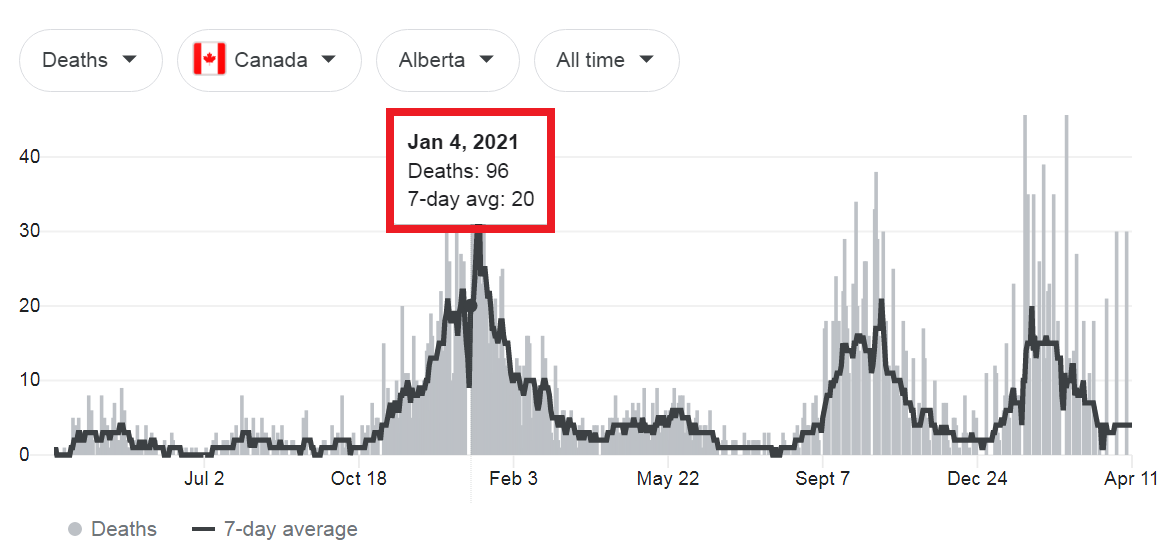
You’d remember if there were 162 deaths per day in Alberta, alone. In fact, at this time, the 7 day average for this time was 18 deaths per day and has only 3x beat more than 40 deaths on any single individual day:
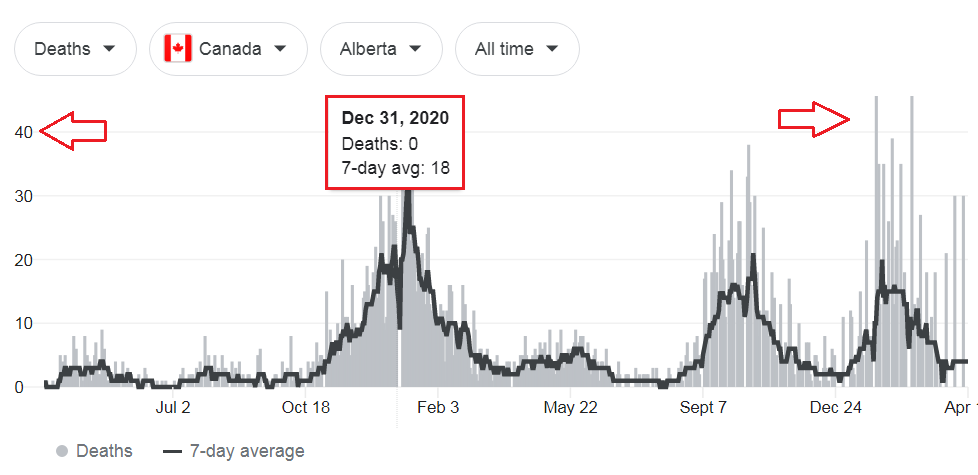
And, for these days, December 29-31st, 2020, there were only a total of 57 Deaths.
Tragic, I know…I’m not trying to minimize the tragedy in all of this, but 57 deaths over 3 days is a lot less tragic than 485.
This is about a 50% markup on Deaths for 2020, which is pretty significant.
It was around this very time, if hadn’t been occurring all along, that they realized that COVID deaths weren’t high enough but with there only being a delay from December 29th, 2020 to January 3, 2021 they would have needed to have rationalized the deaths that took place over this period and either lump sum another 500 deaths or fade them in.
[Spoiler alert - they faded them in]
December 29th to January 2nd, 2021 (1 day lag in numbers), according to the current Data Download, there were a total of 94 deaths.
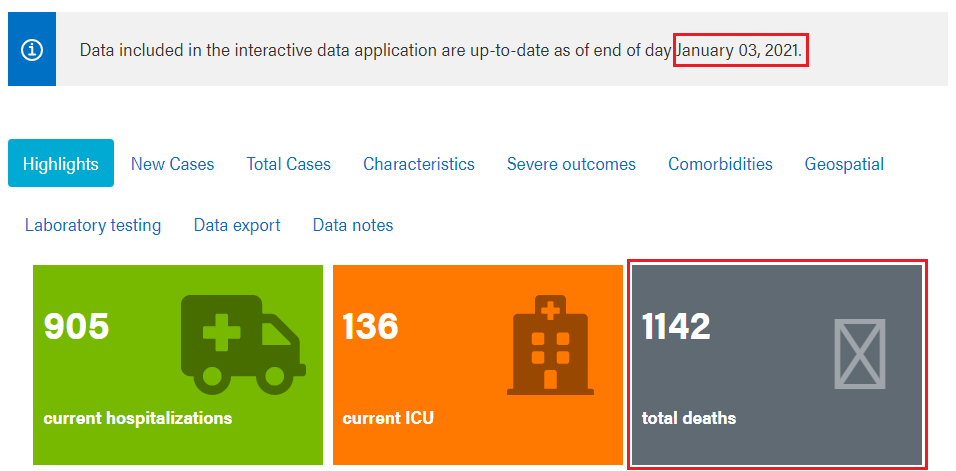
The January 3rd, 2021 reporting for the deaths up to January 2, 2021 from December 29, 2020 was 1142 (January 3, 2021) - 1049 (December 29, 202) = 96, giving a difference of 2 deaths…no big deal.
Appreciating that there may be some time to effectively diagnose the cause of death and a couple numbers may be added or subtracted throughout isn’t really that significant. If it adds up to almost 500, that’s a pretty big deal.
Now…if you checked the overall, looking at January 4, 2021 you’d actually see this 96 popping up on January 4th, 2021 - again, appreciating a little lag in reporting offical Provincial to other dashboards or sites.
Now, to fade in the numbers and to not make the fraud look too obvious, they couldn’t drop in big numbers without gaps in reporting or over-weekend totals so they just happened to drop in a few here and a few more there to keep the dashboard moving and the increase in Hinshaw’s reporting going, without too much scrutiny.
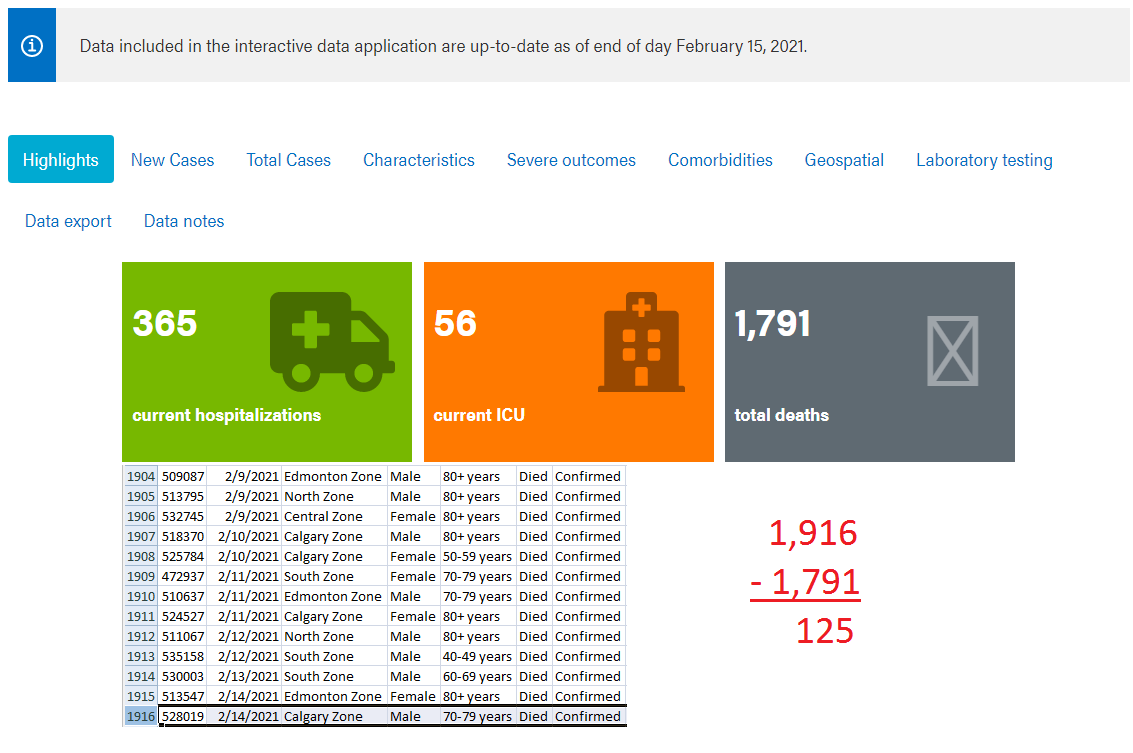
By Mid-February, 2021 they’d already faded in 360 of these 485 additional deaths, leaving only 125 left to go:
And by the End of March, 2021 they’d closed the gap to 36.
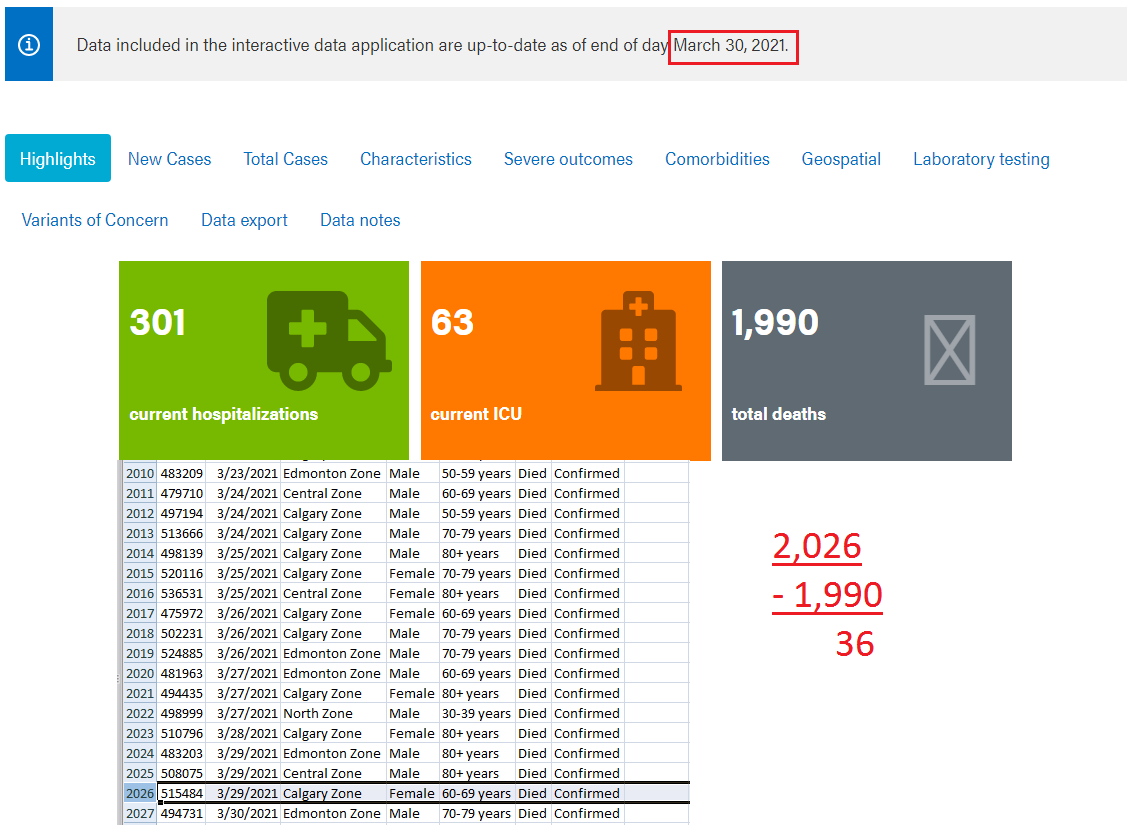
3 Months of fading in 485 deaths into the equation and then by the End of April, 2021:
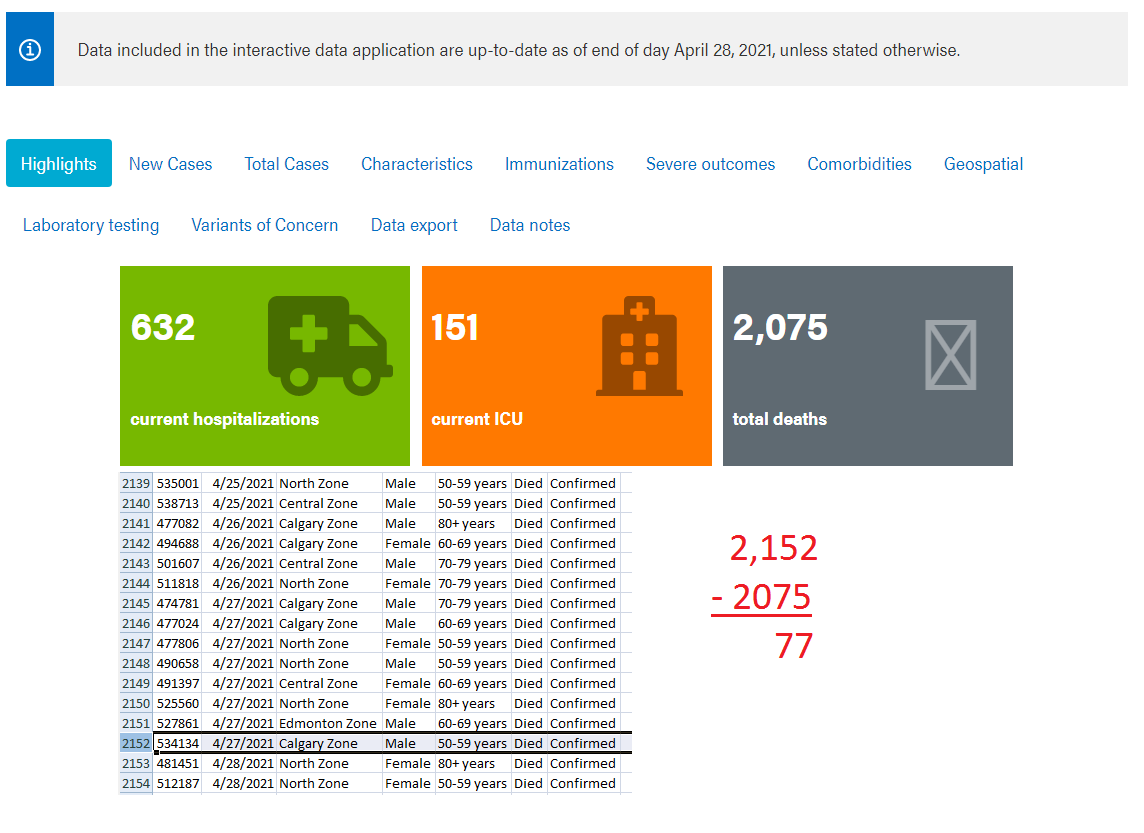
We were out of sync by not just the 36 deaths that they’d failed to fade in, but add in another 41 Deaths to INCREASE this number to 77.
These numbers have a pattern of being falsified and it’s not just the corrections that Dr. Hinshaw noted last month when there was a negative number (first that I’d seen in reducing these totals). These numbers were purposely padded, retroactively and then faded into the mix overtime. It’s actually impossible to figure out how many deaths were added over the last 2 years but if nothing else, 50% added to just 2020 alone is a pretty big deal.
These deaths were used to rationalize the Non-Pharmaceutical Interventions and to push people into Vaccines that they didn’t want nor need and if you asked Dr. Hinshaw, while she was doing this on a daily basis, her exact reply was:
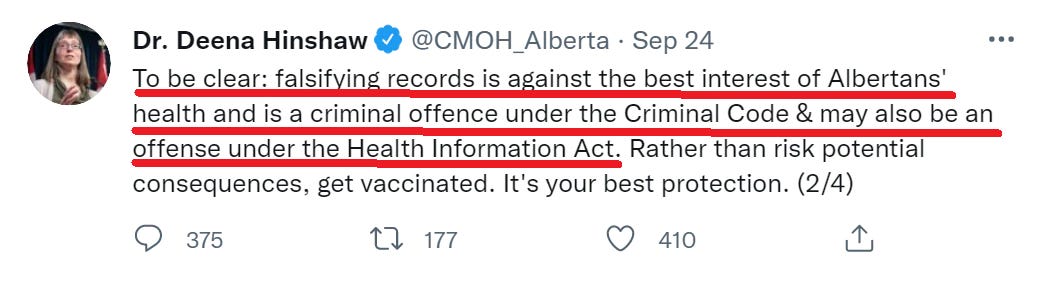
Scoldingly accusing others of what she’d been doing all along and letting them know that this is a Criminal Offence.
