


About 700 COVID Deaths Were Added to Alberta's Counts for 2020 and 2021
By my best guess

I was recently asked how many deaths were added to the Alberta COVID death rate after somebody read through my Why did Alberta Retroactively Add 50+% of COVID Deaths to Pre-Vax Roll-out Numbers? substack.
All honesty, just knowing the data was padded, I had’t put a lot of thought into it and consequently couldn’t come up with an answer. It’s been bothering me for a few days now and I finally sat down to try and figure this out.
Going to the Provincial Site, you can download a copy of the Case Data. Full spread sheet with all of the cases, including current and active, all recoveries and deaths. With a quick sort, you can parse out those who died and sort by month to get what you’d assume to be an accurate count of all deaths and by month/year.
If you did that right now and compared it to the “Highlights” page, these numbers should match, and in fact they do.
3,271 deaths counted in the Data and the Highlight page says:

I’ve done this periodically and figured that comparing the data that I knew was altered to the historical website, would produce some results that may show how many deaths there were. Well, that’s about 635 days of comparison and with the lag on WBTM and the number of days that weren’t updated on the Provincial Site, seemed to be a task that could create a mess.
So, instead of doing that, I just a did a Monthly Cumulative Tally to see what I could see and see if I could extrapolate the information that way. To keep things accurate, I would select the last update on the date that I wanted to check. Example - for all deaths up to the End of May, I’d chose June 1, 2020 and compared the Data to the deaths updated on this date.

When you click the link for June 1st, 2020, it brings you to the following highlight and the date that was current on this page is the date that I would compare to the data:
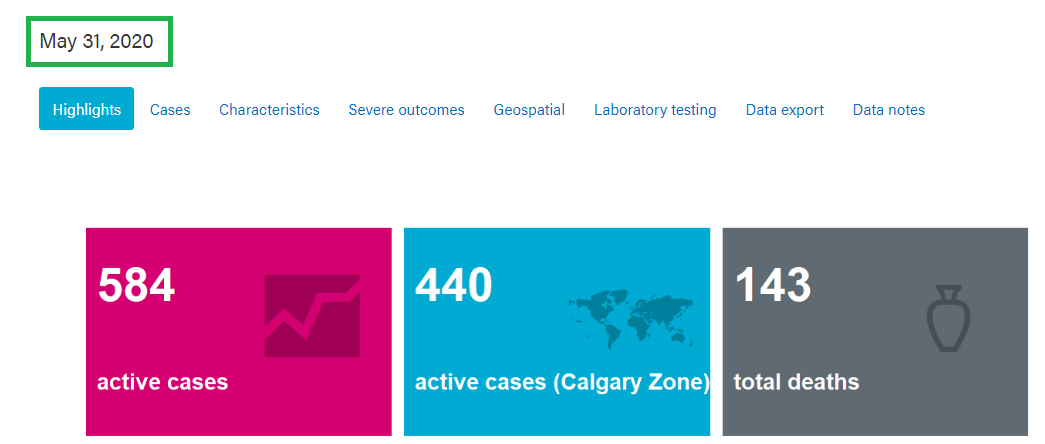
Counting all of the deaths for the months and comparing them to the website updates I created a chart to see what this would look like as well as included a chart for the difference in the numbers left over.

Outlined in the Red Boxes was the period from 2020 where I noticed that an additional 400+ deaths were added in my previous substack - 449 here to be exact, but then also noticed that there were an additional 182 deaths added to September and about 85 in April.
So, 449+182+85 = 716/3271=22%
Is this an accurate number?
No.
It’s a reasonable ball park as to how many were added.
The real question, is why?
Thanks for doing this work. I’m in Alberta, so very interested in the stats.
I note that the number on the website does catch up to the numbers from the database. I also note that this happens when there is a rapid increase. My guess is that it is just delay in loading the numbers into the database. The website admin takes the numbers as they are On the database at the end of the day. The database admin keeps adding info the next days.
So far, my eyes have seen, and my head has reasoned, as Trump said, the Cure is worse than the disease. The Result? I no longer have trust in my Government's plan to extend my life. I see the Annual, never-ending Vaxx as a means of controlling my lifespan, controlling how and when I will die. The Agenda21 depopulation plan has been barking in the background for decades, here it is!